TCFD Core Elements and Financial Disclosure
| Core elements | Action Plan. |
|---|---|
| Governance | The Sustainable Development Committee is charged with convening relevant units to annually assess and confirm the potential impacts of each risk topic on the organization, both internally and externally. This includes identifying and evaluating the causes of climate change risks and developing responses to climate impacts. Furthermore, annual meetings are conducted to prioritize initiatives for corporate sustainable development, including matters related to climate change, in order to fulfill corporate social responsibility through concrete actions. At the beginning of each year, the committee reports the implementation status of the previous year's risk management efforts to the Board of Directors. |
| Strategy | Identify physical and transition risks and opportunities based on business types and operational conditions and actively promote green energy and environmental protection policies. In response to the impact of global climate change and the greenhouse effect on the environment, the Company has developed energy-saving and carbon-reduction measures. These measures include promoting energy conservation in offices and public areas, reducing waste, and implementing green procurement practices by purchasing products with energy-saving and environmental labels. |
| Risk Management | FORTUNE ELECTRIC has already established a risk management organization and system. The Company has created its risk management system according to the ISO 31000 risk management framework and based on the PDCA management cycle, to comprehensively manage various strategies, operations, finances, hazards, and other potential risks (including risk events such as operational and environmental climate) that may impact its operations and profits. This system aims to provide sufficient risk management for the Company’s stakeholders, shareholders, and other relevant groups. |
| Indicators and Objectives |
In response to mitigating the impacts and risks associated with climate change and to meet targets related to green energy and carbon reduction, metrics have been utilized to manage risks and opportunities linked to climate change:
• The Company has established an energy management system compliant with ISO 50001, prioritizing solutions and responses to issues raised by stakeholders, identifying, responding to, and improving potential risks and opportunities. Relevant projectshave been established based on the statistics of electricity, oil, and water consumption to implement energy conservation and carbon reduction measures. Additionally, the Company demonstrates its responsible corporate performance through energy management, water recycling, waste resource recovery, and carbon footprint reduction. • Power consumption: The Company has established an energy management system and relied on third-party verification to develop relevant plans through systematic management. This promotes the implementation of the energy conservation and carbon reduction goal, aiming to save approximately 1% of electricity consumption within the Company. • Waste: The Company has implemented an environmental management system according to ISO 14001, customized to fit the industrial characteristics, to systematically manage process waste, reduce waste, recover resources, and handle other relevant tasks. • Greenhouse gas: The following conclusions are drawn from the internal inventory of greenhouse gases emitted in 2024. The carbon emissions in Scope 1 and Scope 2 reached 24,589.3000 tCO2e and 9,860.3850 tCO2e, respectively. For the greenhouse gas SF6, the Company has developed recycling equipment and established a recycling mechanism for processes, detection, maintenance, and renovation, thereby minimizing the environmental impact. Regarding the use of insulating oil, the Company may opt for biodegradable insulating oil, such as vegetable oil, for manufacturing some transformers to make them more environmentally friendly. Concerning the supply chain, some manufacturers have coordinated a recycling mechanism for certain products of the Company to minimize the environmental impact. |
Climate-related Risks and Financial Impacts
Transition Risks and Financial Impacts
| Climate-related Risk | Subject | Potential Financial Impact | Responsive Actions |
|---|---|---|---|
| Risk of Policies and Regulation | Increasingly Stringent Regulations |
* In recent years, governments and international markets have imposed stricter regulations on carbon emissions, energy efficiency, and the development of green products. As a result, companies must allocate more resources to ensure compliance throughout the entire product development, manufacturing, and sales process.
* For FORTUNE ELECTRIC, this may lead to increased R&D expenses and higher costs associated with green design, particularly for high-energy-consuming equipment such as transformers and switchgear, as well as the potential for even stricter environmental standards and market demands in the future. |
• Continue developing transformers, switchgear, and energy storage solutions that comply with international environmental standards.
• Increase investment in green energy technologies, such as high-efficiencytransformers and low-carbon switchgear. • Strengthen internal mechanisms for regulatory tracking and compliance review to ensure all products meet the latest environmental laws. |
| GHG Inventory (Scope 3–5 in Supply Chain) |
* GHG emissions from the supply chain (Scope 3–5) are increasingly subject to regulatory oversight. Companies are expected to account for emissions from suppliers and logistics, which could lead to rising transportation costs and affect overall supply chain management.
* Failure to reduce carbon emissions effectively may impact the company’s green supply chain rating and, in turn, competitiveness in securing orders. |
• Establish carbon emissions management mechanisms for the supply chain and optimize transport schedules to minimize trips and reduce emissions.
• Develop a Supplier Code of Conduct requiring suppliers to improve production and logistics models to reduce indirect emissions. • Implement a carbon footprint tracking system in the Information Center to monitor emissions from business travel and logistics. |
|
| Stricter Environmental Laws |
* Increasingly stringent environmental laws may raise FORTUNE ELECTRIC’s capital expenditures and operating costs. In particular, the value of high-carbon-emission and energy-intensive equipment used in manufacturing transformers, switchgear, and other power transmission and distribution products may decline.
* Additionally, plant expansion plans may face increased ESG scrutiny, potentially leading to higher expansion costs. |
• Gradually phase out energy-intensive, high-emission equipment and improve production energy efficiency.
• Incorporate carbon emission and environmental impact factors in new plant assessments to ensure compliance with low-carbon operational standards. • Proactively respond to investor ESG expectations to optimize capital expenditures and financial management, reducing future financing challenges. |
|
| Technology Risk | Replacement of SF6 Gas with Low-Carbon Alternatives |
* Currently, FORTUNE ELECTRIC uses SF6 gas in gas-insulated switchgear (GIS), but global regulatory trends are moving toward restricting its use. This may render existing products noncompliant with future market demands, potentially affecting orders and business expansion.
* Moreover, low-carbon alternatives are still in the development stage, and transitioning may result in increased R&D and testing costs. |
• Develop low-carbon alternative gas technologies, such as dry air or other ecofriendly gases, to reduce dependence on SF6.
• Adapt current product designs to comply with regulatory changes and maintain market competitiveness. • Strengthen in-house manufacturing support for R&D to accelerate the commercialization of new technologies. |
| Market Risk | Rising Customer Expectations for Energy Efficiency |
* Customers are placing higher demands on the energy efficiency of power transmission and distribution equipment. This could impact the competitiveness of FORTUNE ELECTRIC’s transformers, switchgear, and energy storage products.
* Failure to meet customer expectations for high-efficiency products may result in unsuccessful bids and negatively impact business performance. |
• Develop high-efficiency transformers and switchgear that meet both customer needs and regulatory standards.
• Collaborate with customers on technical development to ensure product designs align with market demand. • Promote a green supply chain to ensure stable access to high-specification materials. |
| Increased R&D Costs and Resource Allocation | * In response to market changes and regulatory requirements, FORTUNE ELECTRIC must invest more heavily in R&D and innovation. This will raise R&D expenditure and necessitate more precise resource allocation to ensure a return on investment. |
• Promote open innovation through collaboration with academic institutions and industry alliances to accelerate technological breakthroughs.
• Enhance internal R&D risk management to maximize the effectiveness of technology investments. |
|
| Goodwill Risks | Net Zero Carbon Transition Pathway |
* The global push for net-zero carbon emissions is reshaping operational models, particularly in the power equipment and energy storage sectors.
* To meet government and market expectations for low-carbon equipment, FORTUNE ELECTRIC must continue to invest in high-efficiency transformers, solar, wind, storage, and EV charging infrastructure, while expanding its warehousing and production capacity to meet rising market demand. |
• Continuously develop or upgrade high-efficiency and energy-saving products and promote smart factories to enhance product competitiveness.
• Actively participate in government projects to promote the deployment of electric vehicle (EV) chargers in public parking areas and industrial parks, thereby expanding the low-carbon product market. • Improve warehousing and production efficiency to support the transition toward net-zero. • Promote CSR initiatives, such as corporate tree-planting programs, to enhance the brand’s sustainable image. |
Physical Risks and Financial Impacts
| Climate-related Risk | Subject | Potential Financial Impact | Responsive Actions |
|---|---|---|---|
| Acute Risk | Extreme Weather (Typhoons, Heavy Rain) Causing Damage to Facilities and Equipment) | * Flooding at the Taichung and Taoyuan plants due to typhoons or heavy rainfall could disrupt the production of transformers, switchgear, and electric vehicle (EV) chargers. This may result in delivery delays, an increased risk of contract breaches, and higher repair costs. | • In addition to scheduled maintenance of plants and equipment, enhance site drainage systems and improve waterproofing levels of key equipment. Establish emergency response plans to minimize the impact of downtime. |
| Extreme Weather Disrupting Supply Chain and Logistics | * Typhoons and heavy rainfall can delay supplier deliveries and logistics, resulting in shortages of key components (e.g., silicon steel sheets, copper, and aluminum). This can disrupt transformers and switchgear production, increase delivery risk, and raise operational costs. | • Maintain safety stock and sign early delivery agreements with suppliers. Secure alternative transportation arrangements to ensure supply continuity. | |
| Extreme Weather Impacting Production and Workforce Scheduling | * Employee commuting may be disrupted by severe weather or natural disasters, which can impact plant operations and production schedules. This can lead to delayed deliveries and increased costs due to overtime. | • Implement flexible work hour policies to ensure the availability of a critical workforce. Strengthen remote work capabilities to reduce operational risks. | |
| Extreme Weather Delaying Construction Projects | * Typhoons may disrupt power transmission and distribution projects, as well as EV charger installations, potentially causing schedule delays, late penalties, and reduced credibility in project fulfillment. | • Incorporate buffer time into construction schedules and avoid typhoon seasons. Ensure contingency flexibility in project timelines. | |
| Extreme Weather Damaging Operational Equipment | * Power equipment and EV chargers may be damaged by storms, affecting customer electricity access and user experience, leading to higher emergency repair, maintenance, and replacement costs. | • Enhance equipment weather-resistance testing. Implement emergency restoration service mechanisms (especially for natural disasters). Establish post-typhoon inspection and rapid repair protocols to ensure customer power recovery and service continuity. | |
| Long-term Risk | High Temperatures Impacting Factories and Outdoor Work | * Rising summer temperatures may drive up cooling and air conditioning costs, decrease production efficiency, and heighten the risk of heat-related injuries among outdoor workers, leading to increased medical expenses and compensation claims. | • Strengthen factory cooling systems and optimize shift schedules and work hours. Provide heat protection equipment and financial subsidies for outdoor workers. |
Climate-related Opportunities and Financial Impacts
| Type | Climate-related Opportunity | Potential Financial Impact | Responsive Actions |
|---|---|---|---|
| Market | Growing demand for power equipment under global resilient grid initiatives and net-zero trends | * The demand for power equipment continues to grow steadily, but supply shortages and rising operational costs resulting from global trade tensions pose significant risks. | • Continuously optimize production lines, enhance product competitiveness, diversify supply sources, and integrate core supplier teams. Leverage the 60% production activation mechanism to ensure timely and quality deliveries and strengthen reliance among Tier A customers. |
| Adoption of low-carbon gases (SF6 alternatives) in gas-insulated switchgear | * Successfully developing new products enhances market competitiveness, increases order volumes and revenue, and ensures compliance with environmental regulations, supporting government and corporate procurement. | • Conduct in-depth market analysis, monitor regulatory trends, and maintain close collaboration with customers to align product development with market needs, improving business expansion outcomes. | |
| Enhanced brand image and market competitiveness | * Although green marketing may increase costs, it helps boost brand visibility, attract potential customers, enhance corporate social image, and drive business growth. | • Actively participate in major international exhibitions and technical seminars on energy efficiency, engage customers, increase brand exposure, and enhance loyalty and market recognition. | |
| Expansion of EV charging infrastructure market | * EV charging businesses can generate charging service fees, secure government subsidies and public tenders, and boost market share. | • Actively participate in government tenders, collaborate with public parking lots to expand charger deployment, increase market penetration, and develop smart charging management systems to enhance service competitiveness. | |
| Energy Source | Optimization of factory energy management and standardized air-conditioning settings | * Installing temperature sensors and an energy management system requires initial investment but reduces long-term electricity consumption, lowers energy costs, improves operational efficiency, and reduces carbon emissions. | • Install temperature sensors and integrate visualized management systems to enhance energy monitoring, maintain optimal temperature ranges, and reduce unnecessary power consumption. |
| Products and Services | Use of low-carbon gases (SF6 alternatives) in gas-insulated switchgear | * As the market shifts toward eco-friendly switchgear, developing low-carbon gas products secures early market entry, improves competitiveness, and drives revenue growth. | • R&D teams are actively engaged in developing new low-carbon gas switchgear and collaborating with domestic and international standardsetting bodies to ensure compliance with global regulations and market trends, thereby enhancing product competitiveness. |
| Resilience | Rising demand for high-reliability equipment (e.g., low/high temperature resistant, humidityproof, shock-resistant) | * Meeting specific customer needs secures early advantages, drives revenue growth, and improves market competitiveness. | • Provide professional pre-sales technical services, develop equipment suited for extreme environments (such as those with extreme temperatures or shock resistance), and continuously implement SIoT-based remote monitoring systems. |
| Government and corporate efforts to strengthen the power grid and electrical infrastructure are driving increased replacement demand | * Drives demand for ultra-high voltage and high-efficiency power equipment, contributing to long-term operation and maintenance revenue. | • Continuously optimize production lines, implement a three-shift system to expand capacity, improve equipment utilization rates, and accelerate technical talent development. • Standardize and lighten product designs to enhance competitiveness. | |
| Resource Efficiency | Water resource recycling and reuse | * Installing a water recycling system requires initial investment but can significantly reduce long-term water procurement costs, lower operational expenses, and enhance ESG performance, increasing competitiveness in government and green energy tenders. | • Guanyin Plant III introduced a wastewater recycling system designed to achieve a 50% recovery rate. Recycled water is used for toilet flushing and plant irrigation, with an eco-pond established to reduce wastewater discharge and improve resource efficiency. |
Investments in Green and Sustainable Development
In 2025, we invested USD 200,000 in Shinhan Card Co., Ltd.’s Social Responsibility Bond (Bond Name: P21SHC1, Code: F17601). This bond has been recognized by the TPEx as a qualified Sustainable Development Bond.
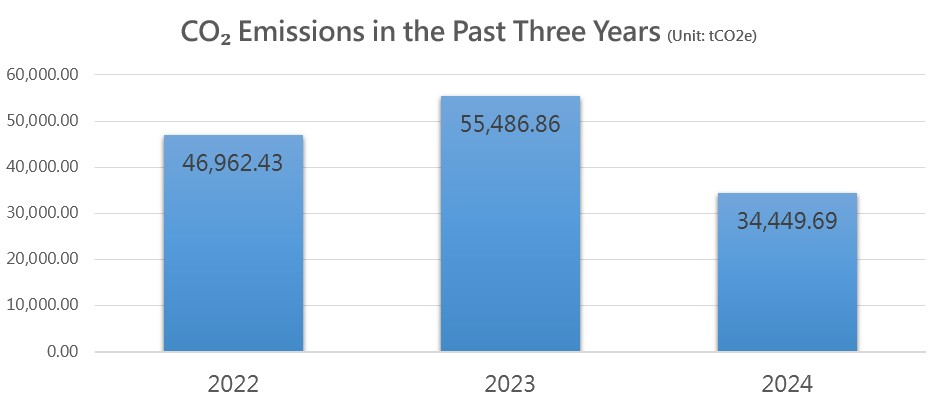
GREENHOUSE GAS EMISSIONS (Unit:tCO2e)
To fulfill its responsibilities as a citizen of Earth, FORTUNE ELECTRIC actively discloses information on greenhouse gas emissions and calculates the total greenhouse gas emissions. The types of emissions include Scope 1, Scope 2, and Scope 3. The carbon emissions generated from Scope 1 include gasoline, diesel, LPG (Liquefied Petroleum Gas), and SF6 (sulfur hexafluoride). In contrast, the carbon emissions generated from Scope 2 primarily include electric power purchased from the Taiwan Power Company.
Additionally, the greenhouse gas (GHG) emission intensity is calculated using “operating revenue” as the denominator to determine the intensity ratio. In 2024, the total GHG emissions amounted to 34,449.6850 tCO2e, resulting in a GHG emission intensity of 1.5442 tCO2e per NT$ million. To strengthen the company’s greenhouse gas management, FORTUNE ELECTRIC conducted a greenhouse gas (GHG) inventory in 2021, in accordance with the ISO 14064-1 standard, which has been set as the base year. Moving forward, the company will establish specific carbon reduction targets to further enhance climate action.
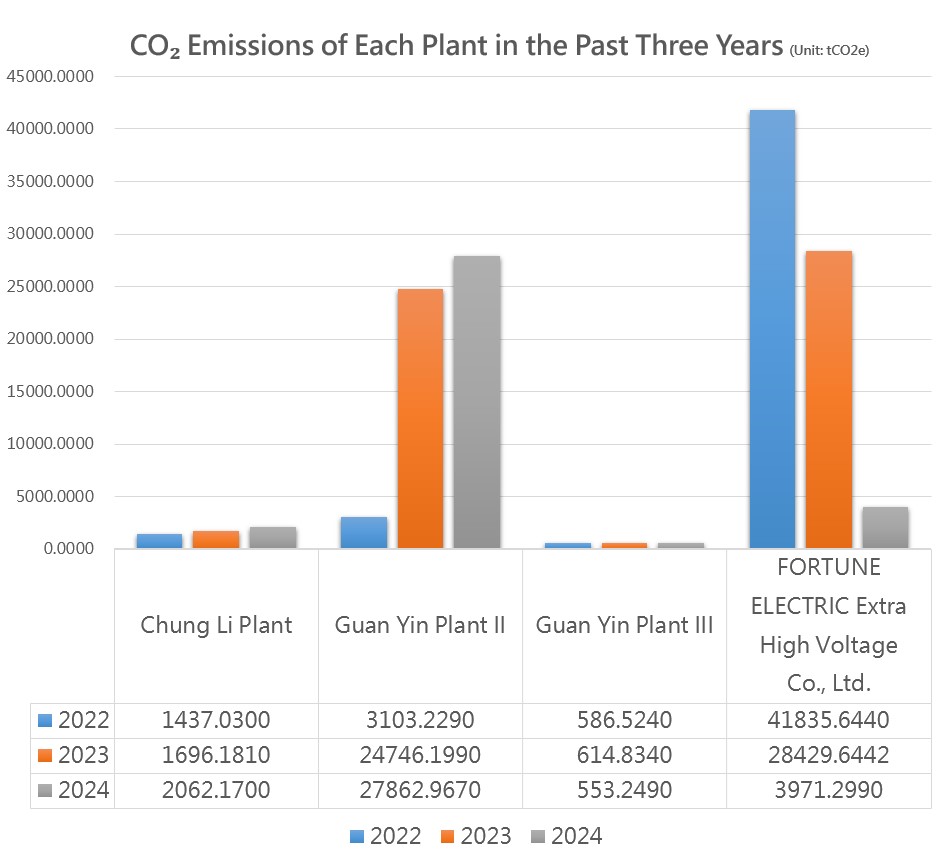
| Factory | Type | 2022 | 2023 | 2024 |
|---|---|---|---|---|
| Chung Li Plant | Scope 1 | 112.7100 | 123.0380 | 163.0890 |
| Scope 2 | 1,324.3230 | 1,573.1430 | 1,899.0810 | |
| Guan Yin Plant II | Scope 1 | 98.1830 | 21,498.0500 | 24,099.4070 |
| Scope 2 | 3,005.0460 | 3,248.1490 | 3,763.5600 | |
| Guan Yin Plant III | Scope 1 | 175.6740 | 185.3720 | 156.0370 |
| Scope 2 | 410.8500 | 429.4620 | 397.2120 | |
| FORTUNE ELECTRIC Extra High Voltage Co., Ltd. | Scope 1 | 39,089.9780 | 25,253.4218 | 170.7670 |
| Scope 2 | 2,745.6660 | 3,176.2224 | 3,800.5320 | |
| Total | 46,962.4310 | 55,486.8582 | 34,449.6850 |
Notes: 1. The Greenhouse Gas Emission Coefficient Management Table (Version 6.0.4), announced by the Environmental Protection Administration on June 27, 2019, was adopted as the source of the conversion coefficient, serving as the primary basis for calculating emission sources within the organization.
2. The carbon emission coefficient of electric power, as announced by the Energy Administration, Ministry of Economic Affairs, was 0.495 kg CO2e/kWh in 2022, 0.494 kg CO2e/kWh in 2023, and 0.474kg CO2e/kWh in 2024, which were used for calculation.
Greenhouse Gas Emission Intensity
| 2022 | 2023 | 2024 | |
|---|---|---|---|
| Greenhouse gas emissions (tCO2 e) | 5,126.7860 | 55,486.8582 | 34,449.6850 |
|
Total output value of all four factories, i.e., Chung Li Plant, Guan Yin Plant II, Guan Yin Plant III, and FORTUNE ELECTRIC Extra High Voltage Co., Ltd. (NT$ 1 million) |
8,167.979 | 15,096.945 | 22,308.586 |
| Greenhouse gas emissions intensity | 0.6276 | 3.6753 | 1.5442 |
Notes: 1. Calculation formula of greenhouse gas emission intensity: Greenhouse gas emissions (tCO2e)/Total output value of all four factories (NT$ 1 million)
2. The data in 2022 didn’t include FORTUNE ELECTRIC Extra High Voltage Co., Ltd. The total output value NT$ 8,167.979,000.
Major Gas Emissions (Unit: ton)
| Type of gas | 2022 | 2023 | 2024 | Increase or decrease compared with the previous year |
|---|---|---|---|---|
| Nitrogen oxides (NOx) | 0.1098 | 0.120 | 0.13 | 8% |
| Sulfur oxides(SOx) | 0.0087 | 0.01 | 0.01 | 0 |
| Persistent Organic Pollutant(POP) | 0 | 0 | 0 | 0 |
| Volatile Organic Compounds(VOCs) | 9.7913 | 21.619 | 23.939 | 11% |
| Hazardous Air Pollutant(HAP) | 0 | 0 | 0 | 0 |
| Particulate Matter(PM) | 0.0466 | 0.049 | 0.048 | -2% |
Notes: 1. The increase of major gases is included in the relevant statistical data of FORTUNE ELECTRIC Extra High Voltage Co., Ltd.
Total Water Withdrawal in All Regions in the Past Three Years (Unit: 1,000,000L)
| Factory | 2022 | 2023 | 2024 | |||
|---|---|---|---|---|---|---|
| Tap water | Rainwater | Tap water | Rainwater | Tap water | Rainwater | |
| Chung Li Plant | 6.925 | 0.005 | 12.660 | 0.008 | 14.165 | 0.016 |
| Guan Yin Plant II | 22.454 | 0.025 | 27.612 | 0.019 | 20.761 | 0 |
| Guan Yin Plant III | 6.187 | 0.300 | 6.879 | 0.315 | 6.879 | 0.32 |
| FORTUNE ELECTRIC Extra High Voltage Co., Ltd. | - | 11.090 | 0 | 12.974 | 0 | |
| Total | 35.566 | 0.330 | 58.241 | 0.342 | 54.779 | 0.336 |
Total Waste Volume and Disposal Methods in 2024 (Unit: metric tons)
| Waste Composition | Total Waste Volume | Total Waste Transferred for Recycling | Total Waste Disposed (Incineration/Landfill) |
|---|---|---|---|
| Hazardous Waste | 0 | 0 | 0 |
| Non-hazardous Waste | 954.047 | 692.588 | 261.459 |
| Total Waste | 954.047 | 692.588 | 261.459 |